
Understanding Raw Data, Radiance Data, and Reflectance Data in Hyperspectral Imaging
By Dr. Alexandre Lussier, Application Engineer - October 28, 2024
Hyperspectral Imaging Data: Overview
The following summarizes the differences between
— and uses of — the various types of hyperspectral data.
Hyperspectral Raw data:
- Dimensionless, uncalibrated (except spectrally), and instrument-specific
- Represented as digital numbers (DNs) or counts
- Can not be compared with data taken by other instruments, under different illumination conditions, or using different acquisition parameters, until those data are further processed to account for those differences.
Hyperspectral Radiance data:
- Measured in the physically meaningful units of microFlicks (power per unit solid angle per unit area)
- Related to the energy emitted or reflected from the object being scanned
- Data depends on atmospheric effects (scattering, absorption) and changes in illumination conditions (e.g., sun angle)
Hyperspectral Reflectance data:
- Represents a physical property of the object, independent of illumination conditions or hyperspectral instrument differences
- Allows for direct comparison between data taken in different measurement conditions or with different hyperspectral instruments
- Ideal for material identification and analysis
The Details Behind Raw Data, Radiance Data, and Reflectance Data in Hyperspectral Imaging
Before discussing
hyperspectral data types, we will review the components that come together to
create hyperspectral data. Each of these components has an impact on
the data captured by the hyperspectral imager.
Hyperspectral
imaging requires a:
- Broad-band source of electro-magnetic radiation (i.e. illumination)
- Object(s) to scan
- Hyperspectral imager
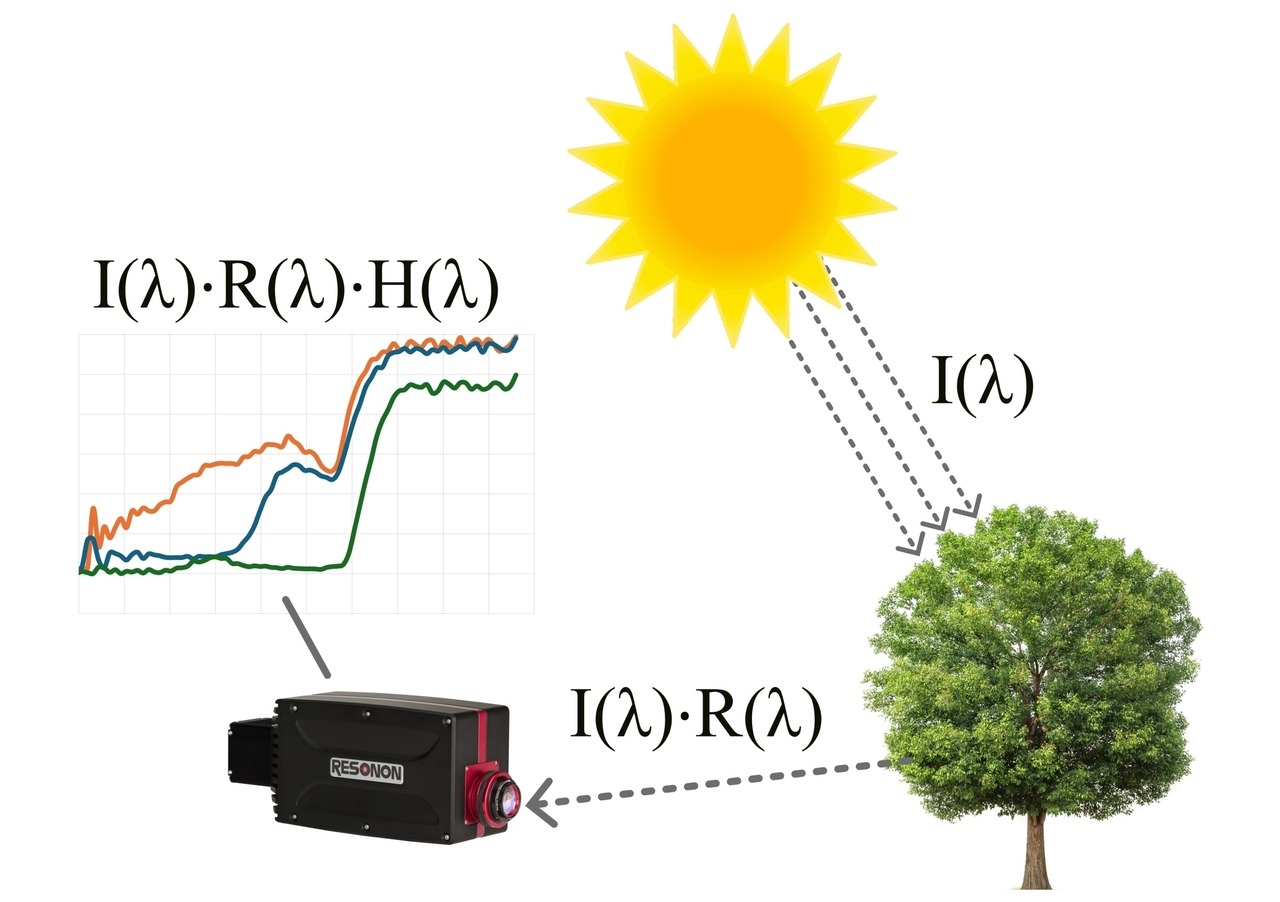
Figure 1: Example showing illumination source, object being scanned, hyperspectral imaging sensor and hyperspectral imaging data.
Illumination
All forms of
broad-band illumination, whether solar or human-made, have varying intensity as
a function of wavelength. See the plots of solar illumination and two of our
benchtop broadband light options below. In Figure 1, the illumination strength as a
function of wavelength is denoted I(λ).
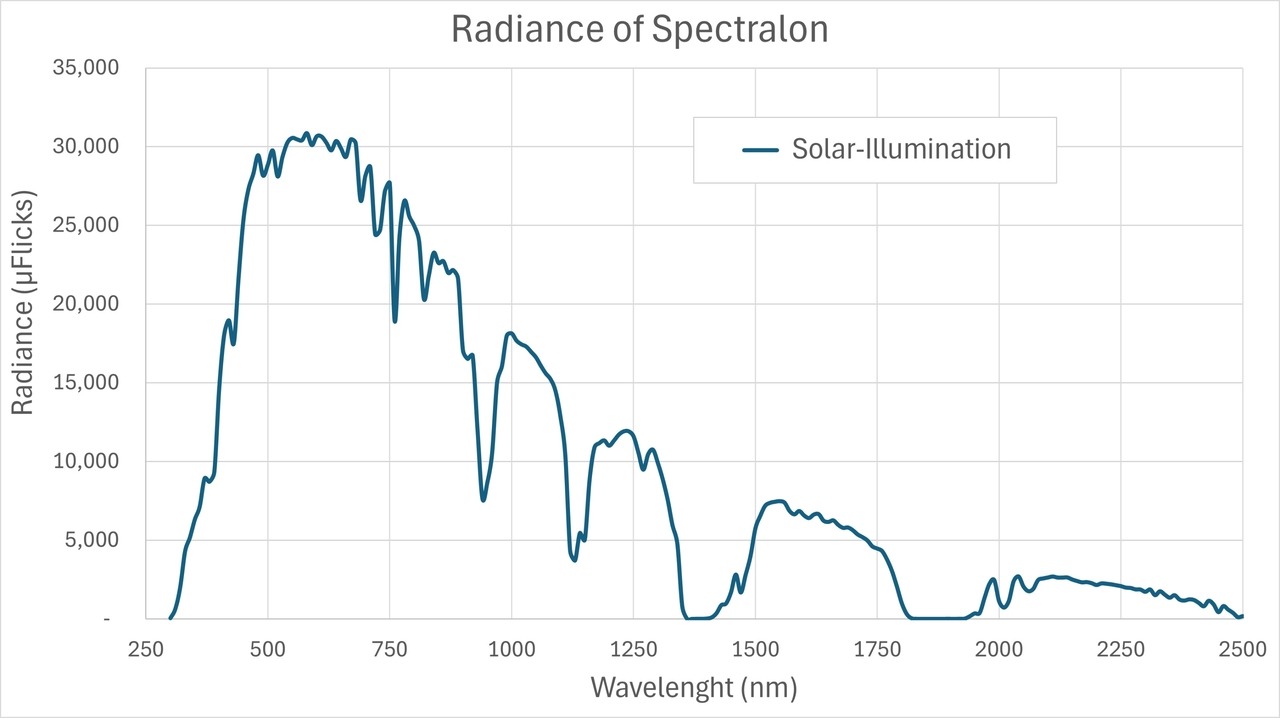
Figure 2: Radiance of Spectralon® illuminated by solar radiation.
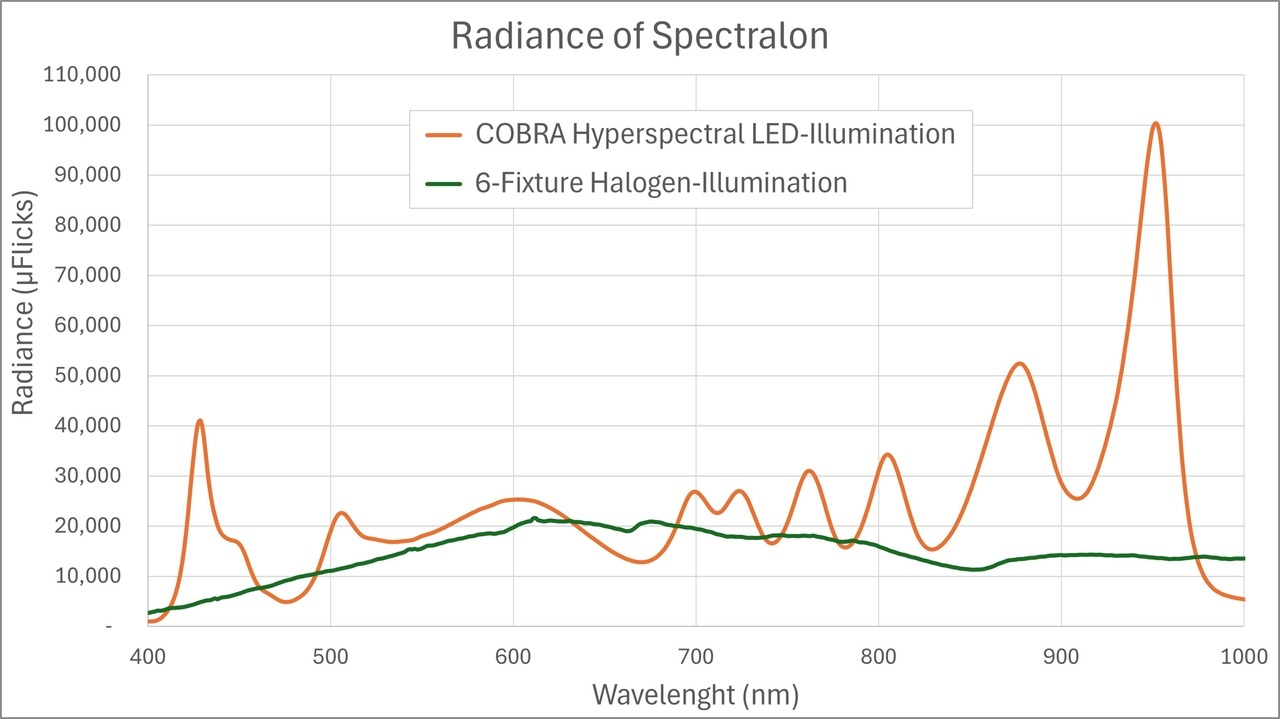
Figure 3: Radiance of Spectralon® illuminated by two different Resonon benchtop lighting systems.
Object Being
Scanned
The chemical composition of an object
governs its interaction with various wavelengths of incident light, determining
which wavelengths of light are absorbed, transmitted, or reflected; measuring
this interaction is usually the purpose of hyperspectral imaging. In Figure 1,
the reflected signal collected by the hyperspectral imager depends on how much
light is incident on the tree, I(λ), and the reflectance, R(λ), of the tree. The
wavelength-dependent reflectance changes from object to object. This is why different
objects appear as different colors to our eye, and why different objects can be
identified using hyperspectral imaging.
Hyperspectral
Imager
The hyperspectral
imager itself has varying efficiency at different wavelengths. An example of
that is the Pika IR+ spectral response plot shown
below. In Figure 1,
the spectral-dependent response function, which depends on the detector
efficiency, is denoted as H(λ).
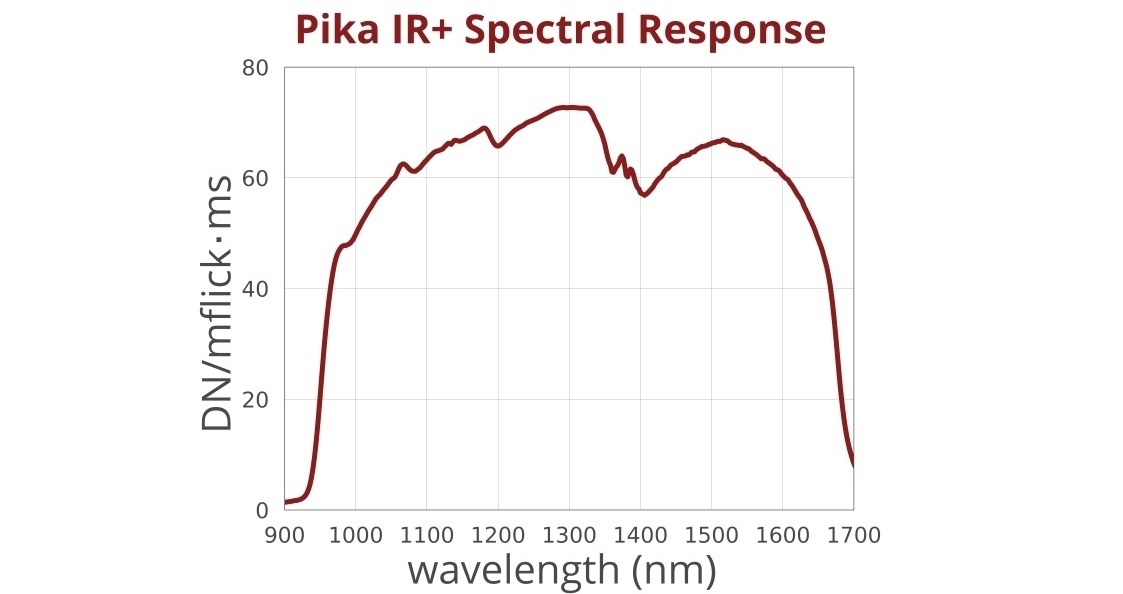
Figure 4: Spectral response plot of Pika IR+ showing wavelength dependence.
Each of the terms
shown in Figure 1 affect the recorded hyperspectral data. Next, we will explain
how each of the different hyperspectral data modes includes or removes these effects.
Hyperspectral Raw Data: The Beginning
Every hyperspectral datacube begins with Raw data. Raw data is the product of all the terms mentioned
above, represented in Figure 1 as I(λ)⋅R(λ)⋅H(λ). These Raw data depend on the wavelength of the input light and are in units of digital numbers, or DNs (sometimes referred to as "counts"). DNs are proportional to the energy incident on the pixel but are dimensionless and uncalibrated units.
The DN for each pixel ranges from 0 (less energy on that pixel than the minimum energy the sensor can resolve) to the maximum value (fully saturated), which is a function of the bit depth of the sensor. For instance, a 12-bit sensor like the Pika L would have a maximum DN of 4095 (2^12 possible digital numbers, starting from 0).
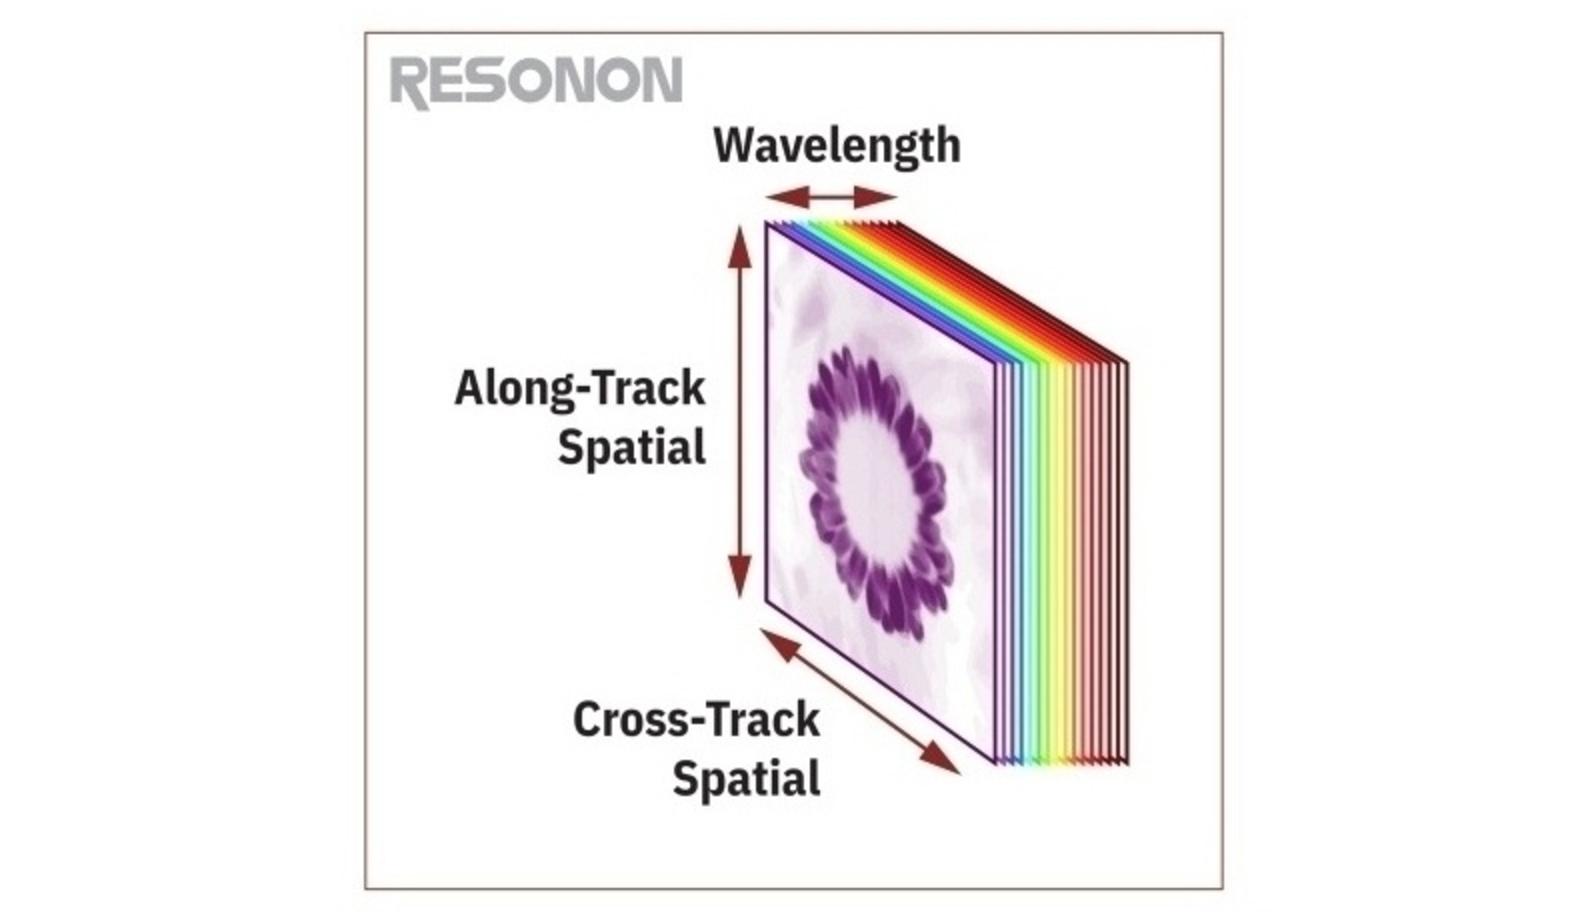
Figure 5: Representation of a hyperspectral datacube.
Raw data represents the
original sensor output, enabling later reprocessing or conversion to other data
types. Raw data cannot be directly compared between different instruments, nor
even between datasets from the same instrument if there are any changes in
illumination or measurement configuration.
Hyperspectral Radiance Data: Quantifying Energy
Radiance is a unit
commonly used for scientific studies with units of power per area, bandwidth,
and solid angle, and is related to the amount of electromagnetic energy collected
by the hyperspectral imaging sensor. In Figure 1 Radiance is represented by the
term I(λ)⋅R(λ).
Radiance data is
derived from Raw data through hyperspectral imager calibration, converting the dimensionless
units of DN into physical units. Resonon, and many other hyperspectral imaging
companies, provide Radiance data in units of microFlicks: \[1\,\mu Flick = {{1\, \mu Watt}\over{steradian \times cm^2 \times \mu Meter}} \]
Radiance data is valuable for studies that seek to quantify the energy collected by the sensor, such as in atmospheric research or when comparing data from different sensors. However, for many applications, the
atmospheric influence and illumination variability that are contained with Radiance
data can be a hindrance.
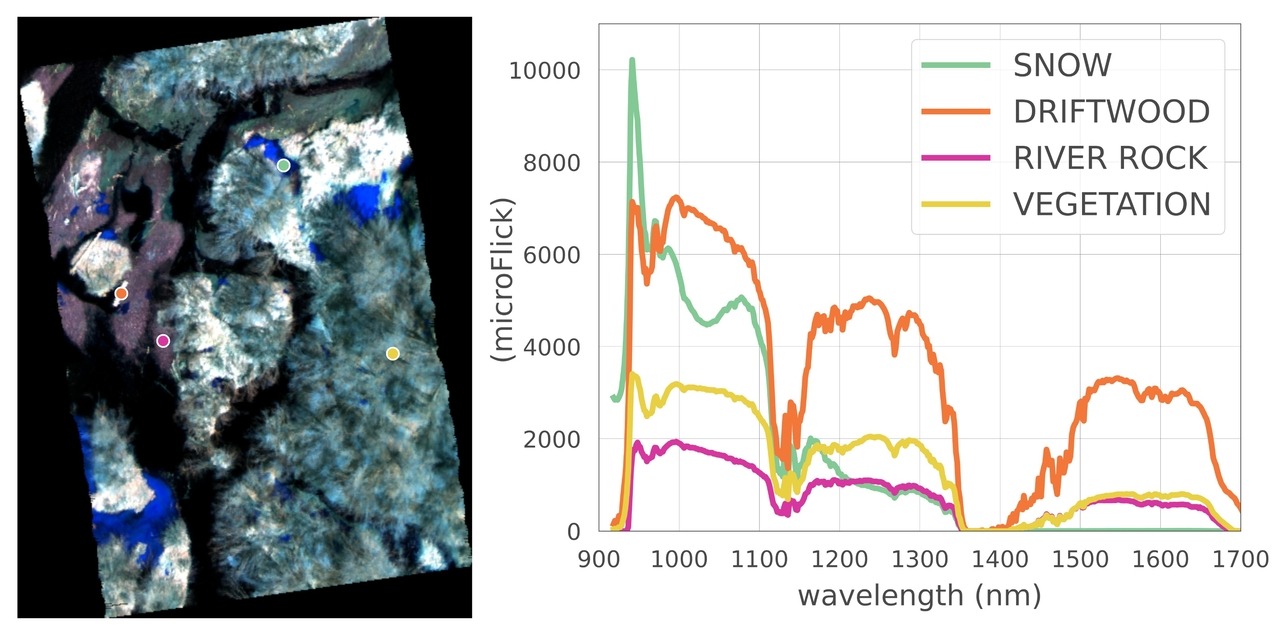
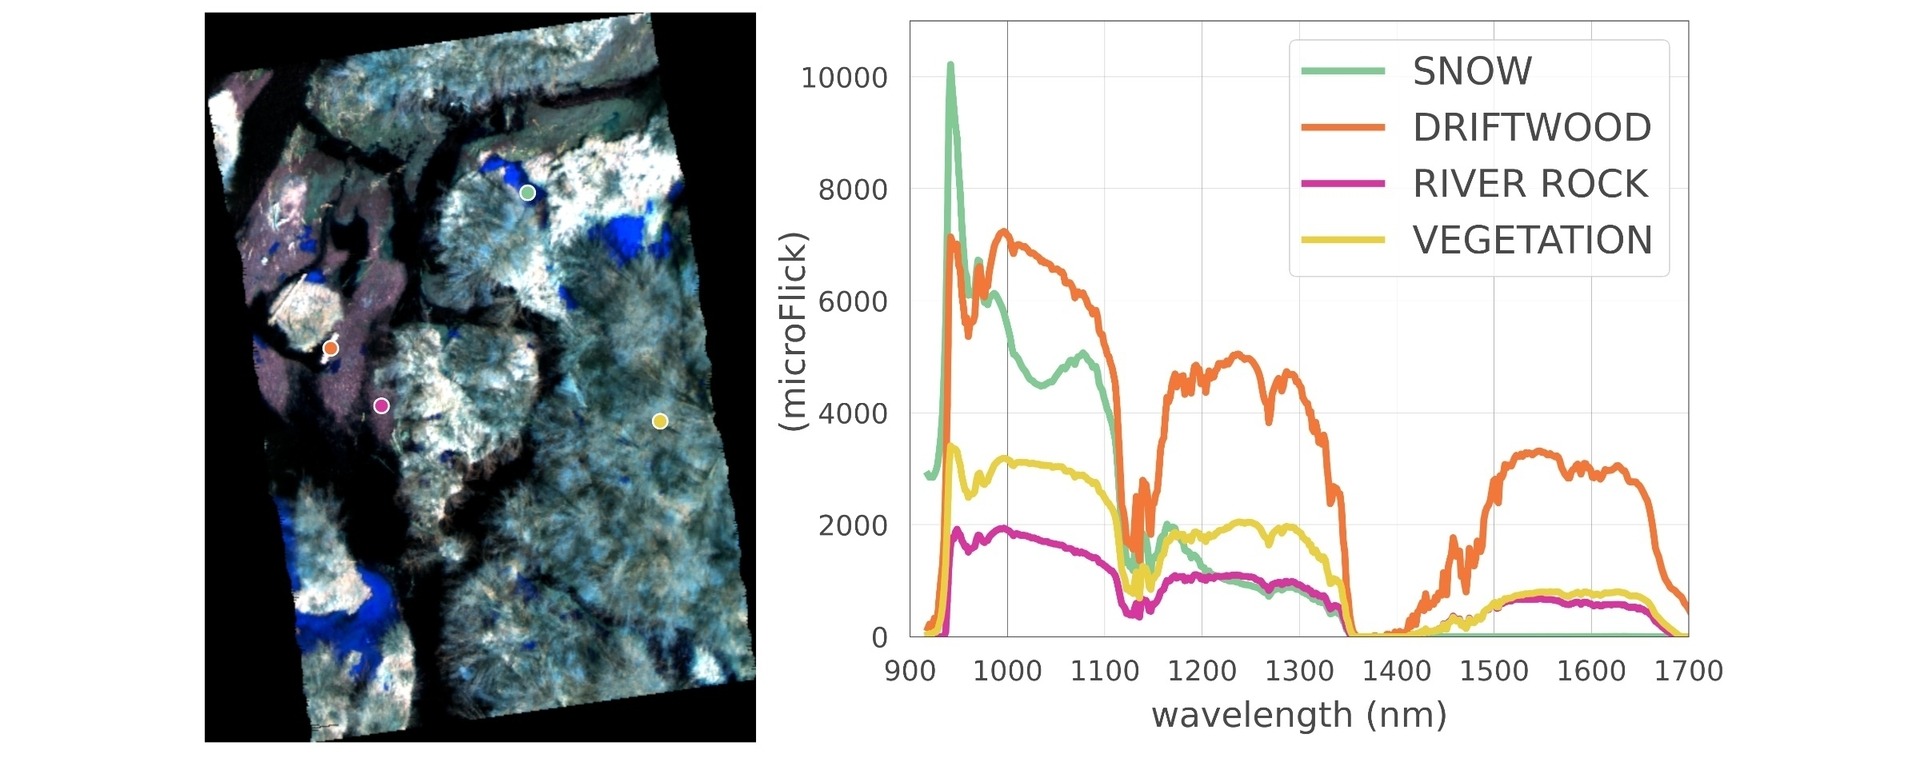
Figure 6: Airborne radiance hyperspectral image with the spectra of several different material types.
To generate Radiance
data, a radiometric calibration is performed on the hyperspectral imager. This
creates an Imager Calibration Pack (ICP file), which can be used along with
appropriate software plugins, to convert Raw data into Radiance data. The ICP
file is unique to the particular hyperspectral camera and objective lens from
which it was created. \[Radiance = {(Raw\,Data - Dark\,Correction^{\ast}) \times Pixel\text{-}by\text{-}Pixel\,Gain^{\ast}} \]
\[^{\ast}\,{Both\,of\,these\,terms\,are\,from\,the\,ICP\,file} \]
Hyperspectral Reflectance Data: Surface Properties Revealed
Reflectance data frequently proves to be the
most useful type of spectral data as it solely depends on the object of
interest. In Figure 1, Reflectance is represented by the
term R(λ). Reflectance is the ratio of the amount of light reflected from an
object to the amount of light incident on the object. Transmittance, which is
similar to Reflectance, is the ratio of light transmitted through an object to
the amount of light incident on the object. As ratios, both are unit-less
quantities, generally displayed as a percentage or as an integer value
(Spectronon uses 0-10,000).
Reflectance and
Transmittance data represent physical properties of the object being imaged. These
data are independent of the illumination, atmosphere, and hyperspectral imager
used. Because of this, these data types are frequently used when attempting to identify
an object via spectral imaging.
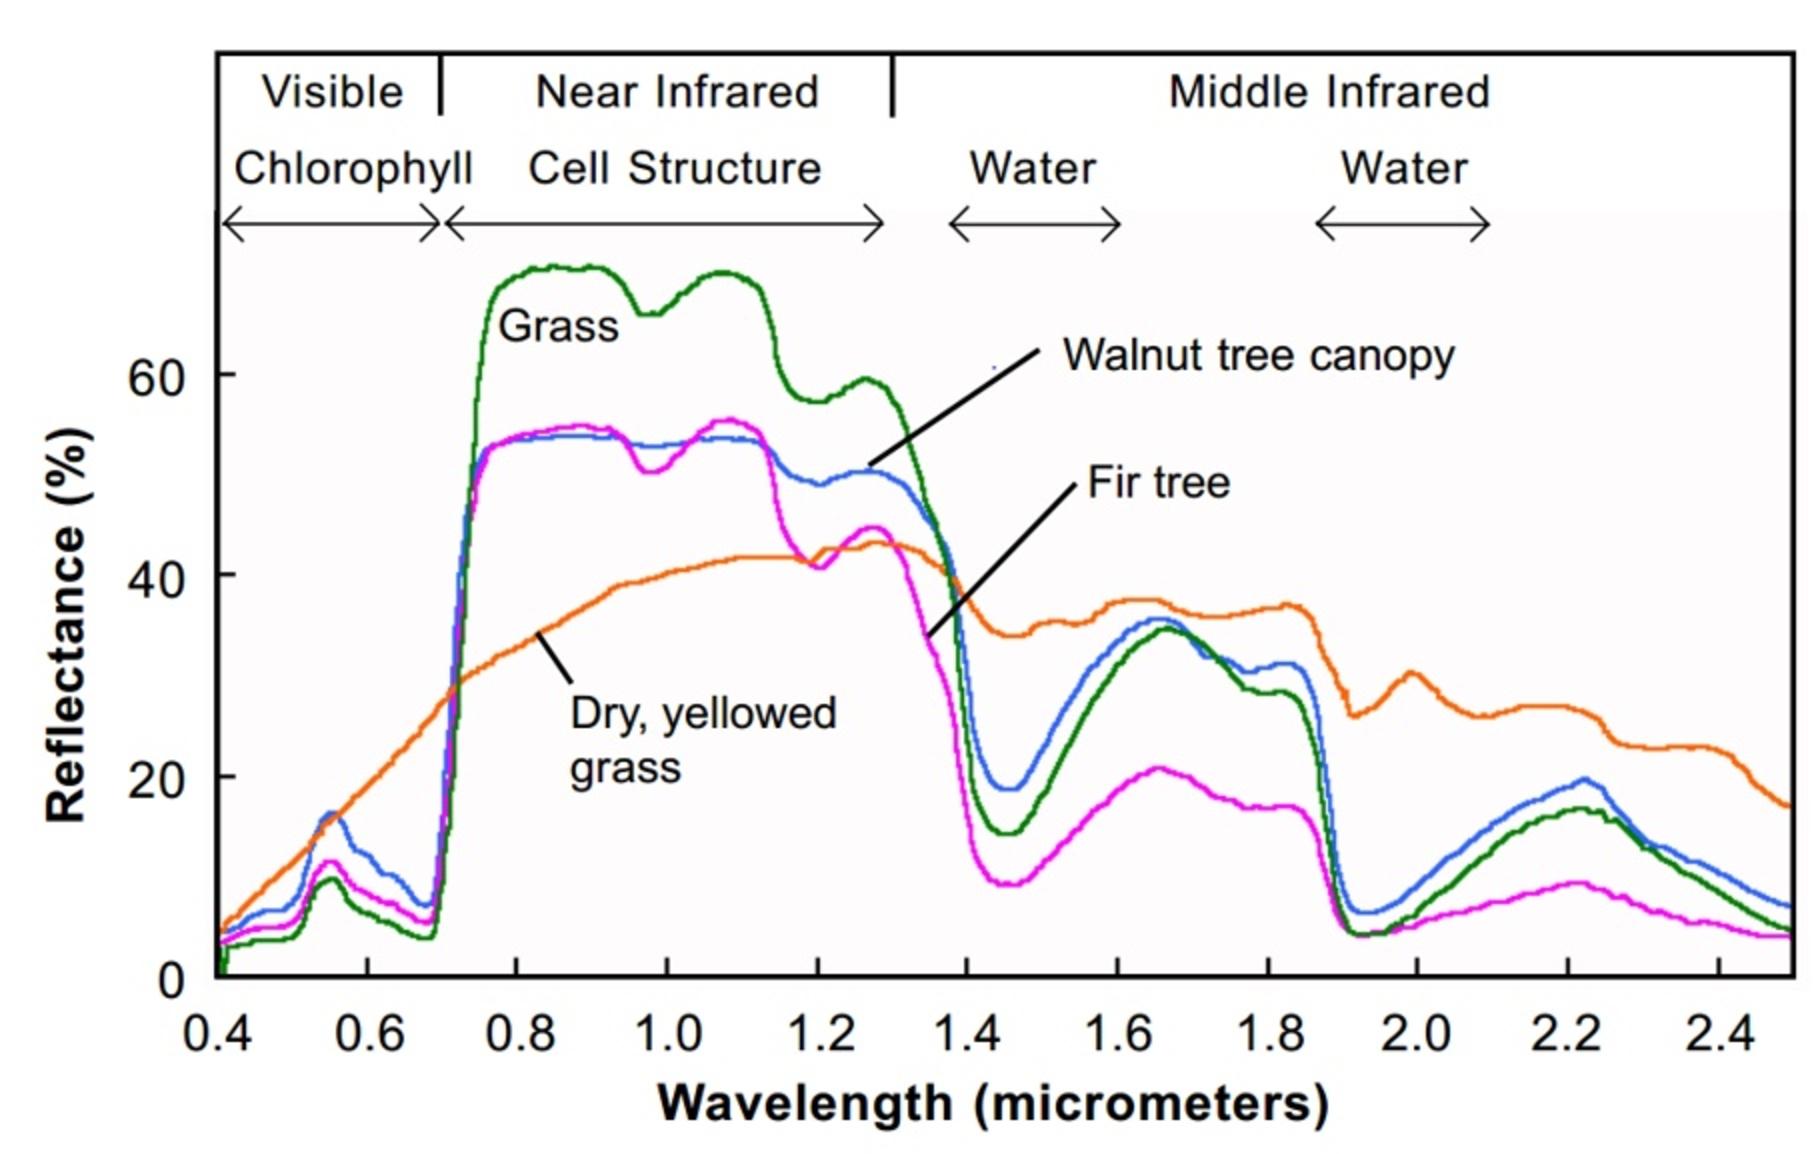
Figure 7: Reflectance data curves of some different plant species (image courtesy of www.microimages.com).
To derive Reflectance
data, it is necessary to remove the hyperspectral imager response and the
illumination spectral distribution from the Raw data. This is commonly accomplished
in one of the following ways:
- For benchtop systems, scanning a reflectance standard (a calibration tile) made of materials like Spectralon®, Fluorilon®, or Teflon. This is sometimes called a “white reference”. The materials above have a nominal reflectance of 1.0.
- For outdoor or airborne systems, using a ground calibration tarp with known spectral reflectance placed in the scene being scanned. The known reflectance of the tarp is used to deduce the incident light distribution and calibrate the rest of the scene.
- For airborne data collection, it is possible to use a downwelling sensor mounted atop the airborne vehicle to collect solar spectral irradiance continuously during flight. Using spectral irradiance and calibration data of the instrument itself enables one to determine object reflectivity.
As an
example, the simplified formula for Reflectance with a hyperspectral benchtop
system is as follows:
\[Reflectance = {{Raw\,Data - Dark\,Correction} \over {White\,Reference - Dark\,Correction}}\]Conclusion: Summarizing Hyperspectral Data Types
Understanding the
different types of hyperspectral imaging data is essential for effective data
collection, analysis, and data interpretation.
- Raw data preserve the original sensor information and allow for reprocessing
- Radiance data are related to the energy reflected or emitted by an object
- Reflectance data reveal properties of the chemical composition of the object being scanned and thus, facilitate material identification
Each data type
serves a specific purpose in the hyperspectral imaging workflow, from initial
data capture to final analysis. By understanding these distinctions,
researchers and practitioners can choose the most appropriate data type for
their applications, whether in environmental monitoring, geological surveys,
agricultural assessments, or material analysis via spectral sensing techniques.
If you have questions or if you would like
to better understand how hyperspectral imaging could help you solve challenges
in your industry or research, please reach out to our Sales Team.
Contact us
Contact us
Technical Cameras
A Picture is Worth a Thousand WordsMarch 15, 2024
Technical
Signal-to-Noise Ratio (SNR) in Hyperspectral CamerasDecember 8, 2023
Contact Us
Click below and our hyperspectral experts will contact you soon.
Complete Hyperspectral Imaging Solutions
Contact
Resonon Inc.123 Commercial Drive
Bozeman, MT 59715 USA
