
An Introduction to Hyperspectral Imaging
Combining the power of digital cameras and spectroscopy
By Dr. Rand Swanson, CEO - October 4, 2023
What is Hyperspectral Imaging?
This post provides you with an easy-to-understand
description of what hyperspectral imaging is and connects its usefulness to real world
applications.
Hyperspectral imaging systems, a type of spectral sensor, are a combination of
spectroscopy and digital cameras. They are used to distinguish between similar
objects or materials in a complex scene. Applied to modern day problems, hyperspectral
imaging can determine the moisture level of plants growing in a field, the
roast time of a coffee bean, or the difference between types of plastic in a
recycling factory.
Digital Cameras: A Critical Part of Hyperspectral Imaging
The most common example of a digital camera is the one inside your mobile phone. Within the camera, a lens collects light from an object or region and translates it into an image of the object on a grid of sensors (Figure 1). Each sensor in the grid is called a pixel, and each pixel produces an electrical signal that scales with the amount of light on the pixel. Bright light on a pixel causes it to produce a large electrical signal, while dim light on a pixel produces a small one.
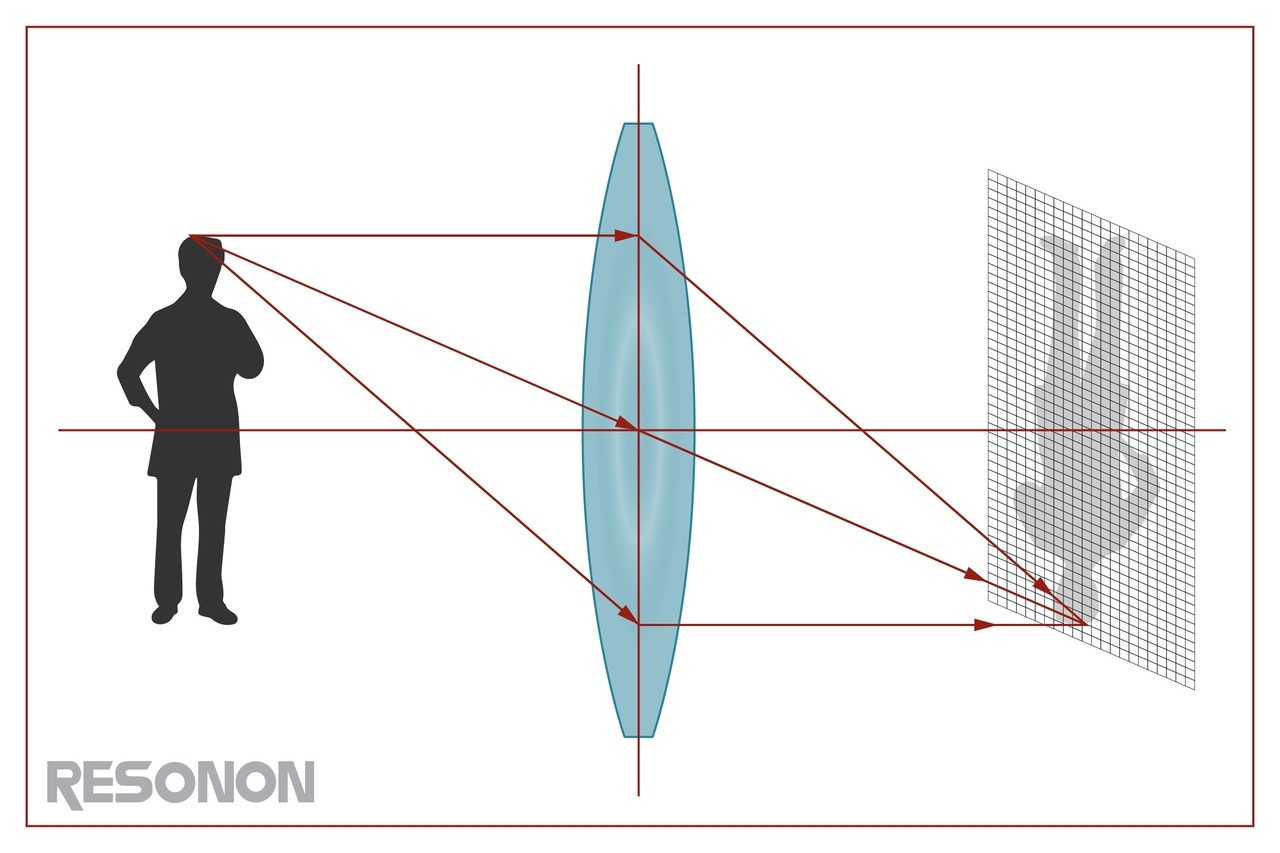
Figure 1: Black-and-white digital imager (i.e., camera); imaging light from an object onto an array of pixels
The camera digitizes the electrical signals from each pixel and assigns numbers accordingly. Large electrical signals from bright light are assigned large numbers and small electrical signals from dim light are assigned small numbers. This results in a grid of numbers that your digital camera uses to display images.
Colors perceived by human eyes can be reproduced from a combination of red, green, and blue. Thus, only three numbers are needed for each pixel in a color digital camera. Each number indicates the brightness of red, green, and blue (RGB ) light. Your camera uses these values to color each pixel on its display.
While digital cameras are incredibly useful tools, the spectrum of colors is much more nuanced than just red, green, and blue. Here is where spectral sensing, and its ability to detect colors your eyes and your camera can not see, comes in to play.
Spectroscopy: The Basis of Hyperspectral Imaging
Spectroscopy is arguably one of humankind’s most powerful, important, and useful scientific tools. How do we know the Sun is made largely of Hydrogen and Helium? Spectroscopy. Where do we get data supporting the notion that the universe is expanding? Spectroscopy. How do we determine the energy levels of atoms? You guessed it – spectroscopy.
An RGB color camera separates light into three colors or bins. In contrast, a spectrometer separates light (including ultraviolet and infrared in many cases) into tens or hundreds of bins, or spectral channels. This separation of light into colors could be done, for example, by passing light through a prism and collecting the signal on a linear array of detectors (Figure 2). The result is a detailed curve called a spectrum.
An RGB color camera separates light into three colors or bins. In contrast, a spectrometer separates light (including ultraviolet and infrared in many cases) into tens or hundreds of bins, or spectral channels. This separation of light into colors could be done, for example, by passing light through a prism and collecting the signal on a linear array of detectors (Figure 2). The result is a detailed curve called a spectrum.
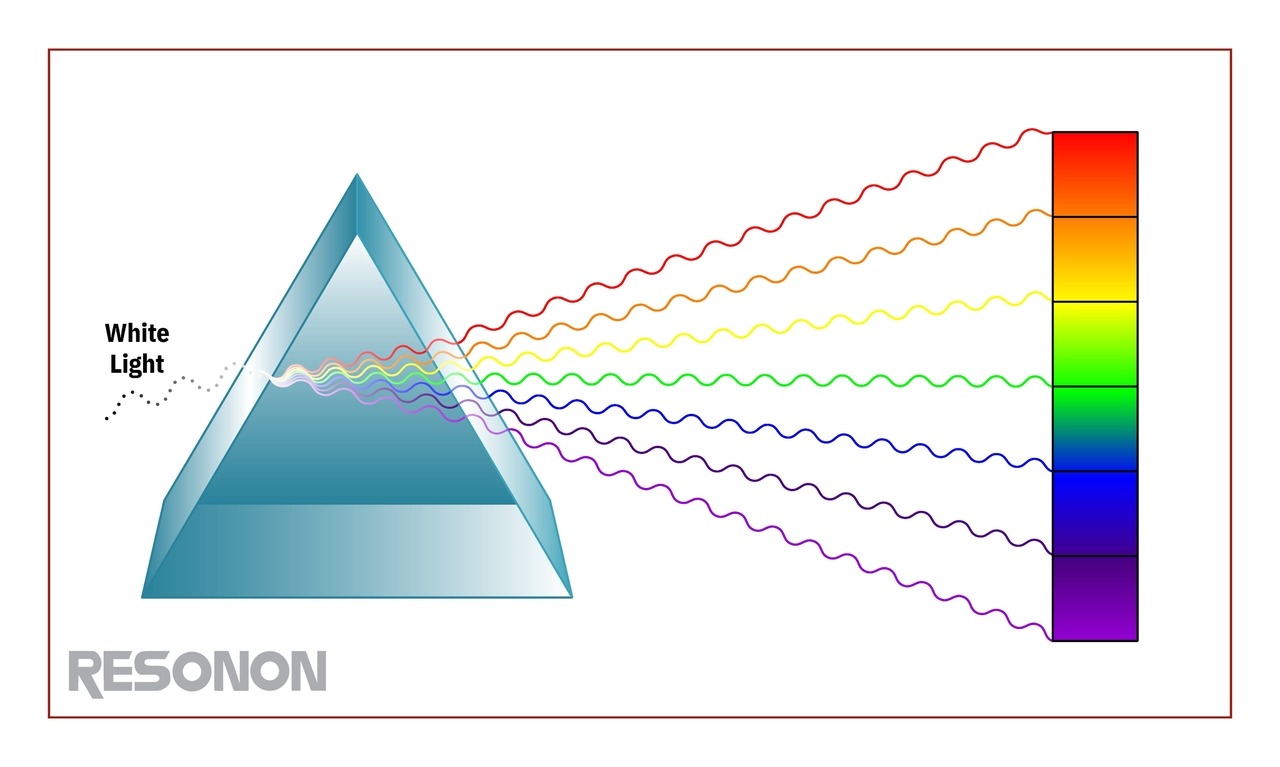
Figure 2: Light separated by a prism and detected by a linear array of detectors
Spectrometers have numerous applications, including:
- Monitoring moisture in materials (moist materials reflect infrared light differently than dry materials)
- Determining plant health (healthy plants reflect light differently than unhealthy plants)
- Finding defects in manufactured materials (defects have different colors)
- Locating methane leaks in pipelines (methane absorbs narrow bands of infrared light)
- ....and much, much more.
If you wish to distinguish between two different materials (e.g., good product and bad product) or even between states of a single product (e.g., a well-roasted coffee bean versus one that needs more time in the roaster), spectroscopy could be an efficient analytical tool.
So, if we have spectroscopy, why do we need hyperspectral imaging?
What about hyperspectral imaging makes it different?
Typically, the objects we want to analyze are non-uniform or located in a complex scene. For example, in the context of crop health, a spectrometer would simultaneously detect light from the dirt in which the plant is growing and from the stems and flowers of the plant. This makes it difficult to extract the signal needed to determine plant health based on the leaves. Similarly, defects in food or manufactured materials are often small, so the signal associated with a defect might be overwhelmed by the signal from the good product. For many spectrometer applications, the sample needs to be carefully prepared so that the signal of interest can be isolated from surrounding signals. This can be time-consuming and not always feasible.
Hyperspectral Imaging: Bringing It All Together
To understand what hyperspectral imaging is, think of it as a standard digital camera that also provides a spectrum for every pixel. Hyperspectral images provide the benefits of an image to locate items or regions of interest along with spectral data for every pixel in the image. Each hyperspectral image is equivalent to many thousands of spectroscopy measurements, with one measurement for every pixel.
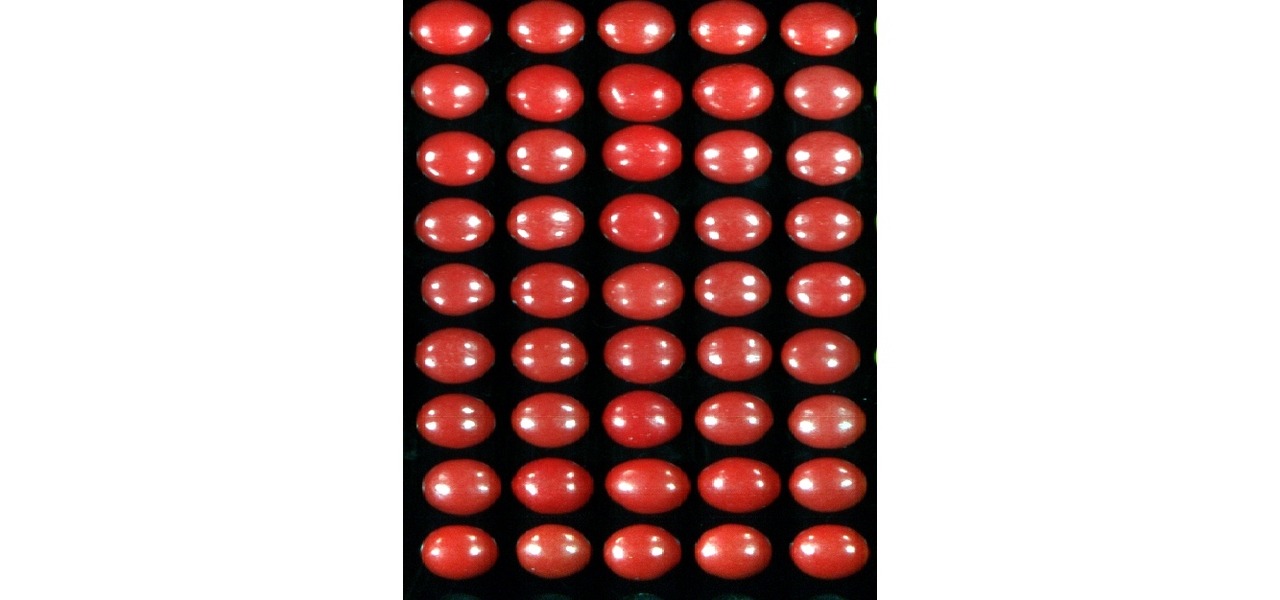
Figure 3: Two types of red candies. Can you tell them apart?
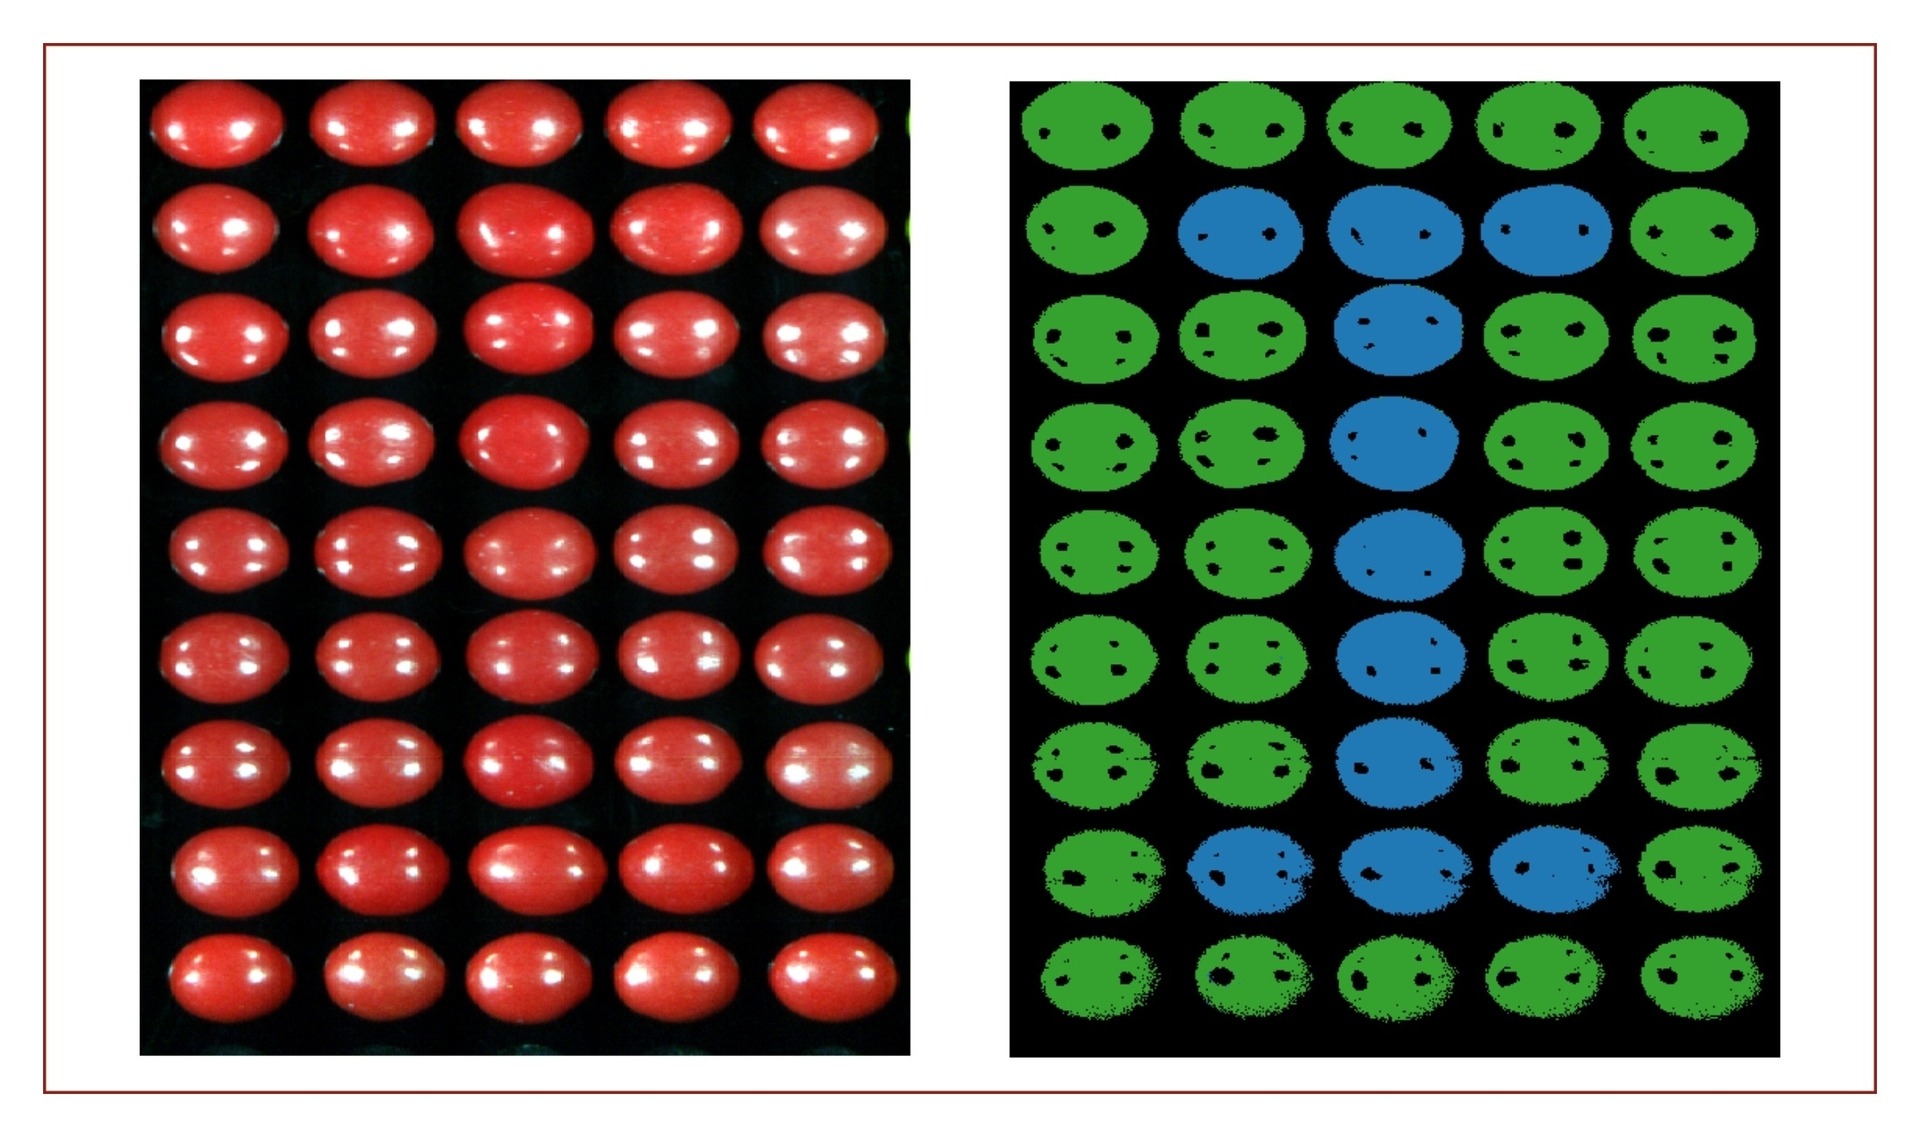
The spectral curves for each candy can be generated by selecting a group of pixels from each one using Spectronon™, Resonon’s free hyperspectral imaging analysis software . Spectronon efficiently analyses the large data set (a data cube) created by the camera and provides insightful analysis of the images. The spectral curves are shown in blue and green in Figure 4. The shaded regions around each curve indicate the standard deviations between pixels for each candy type. Note that there is considerable overlap between the curves in the ~400-550 nm and above ~700 nm ranges, but there is also a clear separation between the curves in the region between ~550-700 nm. This makes identification of the two candy types trivial using spectroscopy even though it is extremely difficult to discern the difference by eye.
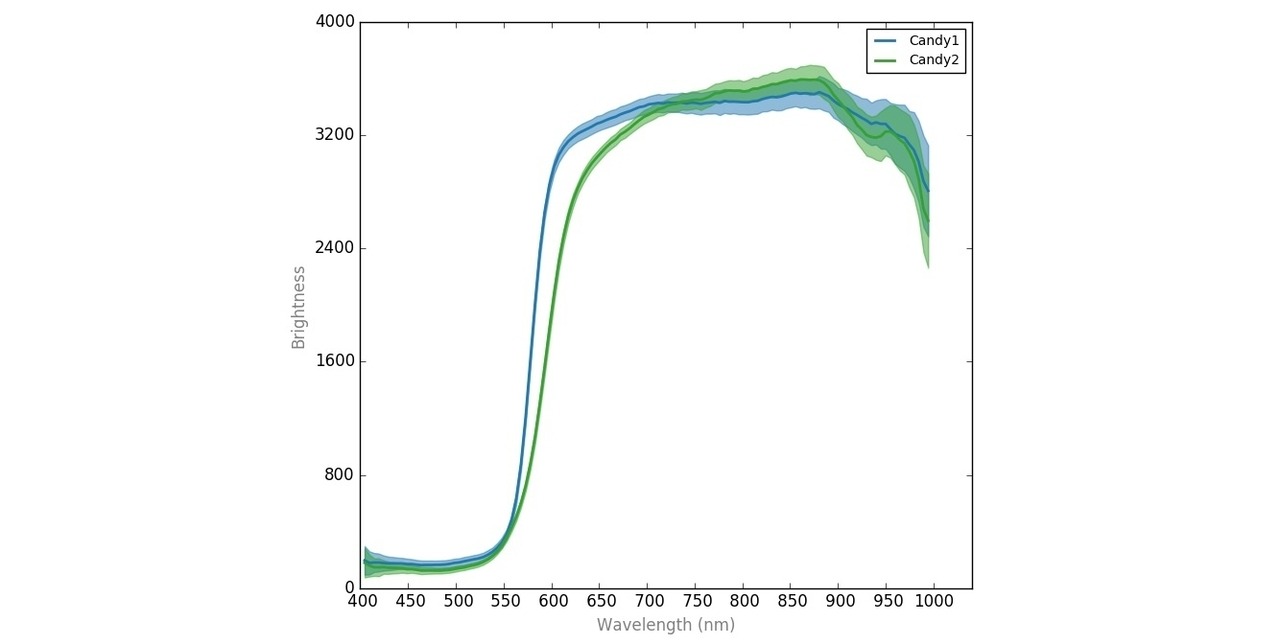
Figure 4: Spectral curves for red candies, one shown in blue, the other in green
A false color image of the candies, designed to easily show the differences, is shown in Figure 5. The black regions inside each candy piece represent glare from light reflecting off the shiny candy surface back into the imager. That glare has a much different spectral curve than the non-glare pixels, making it unclassifiable by the model.
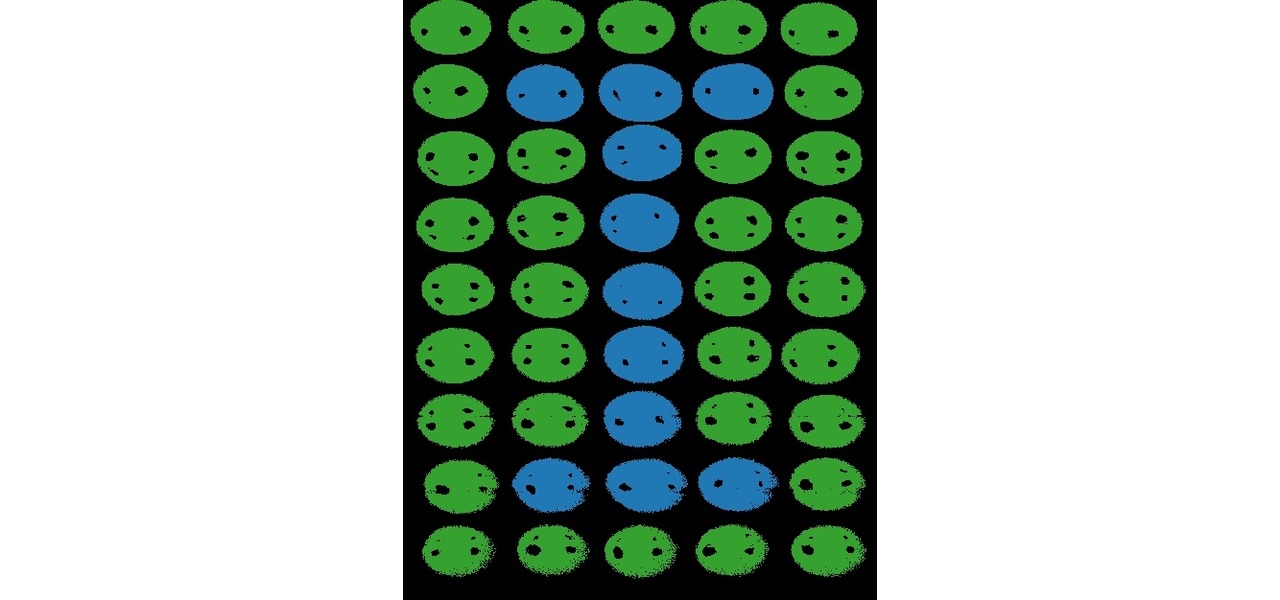
Figure 5: Classification of red candy types, colors correspond with Figure 4
With modern computers, spectral analysis can be carried out for every pixel in a hyperspectral image fast enough that corrective actions can be taken once items have been classified. For instance, air jets or robotic pickers might separate items on a factory conveyor belt based on the hyperspectral analysis performed in real-time.
Hyperspectral Imaging with Resonon
Resonon designs and manufactures hyperspectral imaging cameras that accelerate advancements in science and industrial operations. Whether you are pushing the limits of academic knowledge or improving quality on the factory floor, we are here to help you capture and utilize the data that drives new discoveries and enables your success.
Contact us
Contact usLearn More
Basics Benchtop+ 1 More
Types of Hyperspectral Imaging Systems: Part 1October 18, 2023

Basics
Hyperspectral Imaging 101: Terminology GlossaryOctober 11, 2023
Contact Us
Click below and our hyperspectral experts will contact you soon.
Complete Hyperspectral Imaging Solutions
Contact
Resonon Inc.123 Commercial Drive
Bozeman, MT 59715 USA
