
Spectronon™: Free Hyperspectral Imaging Software
By Thomas Seitel, Senior Software Engineer - November 7, 2023
Hyperspectral imaging creates digital images
with much higher spectral, or color, resolution than traditional color imaging.
If you are new to the concept of hyperspectral imaging, you might want to read
our Introduction to Hyperspectral Imaging. A hyperspectral
datacube (the 3-dimensional image file that is created by a hyperspectral
camera) provides a detailed spectral curve for every pixel in the image. The high
spectral resolution data enables differentiation between materials more
accurately than is possible with color images, expanding possibilities in a wide range of
applications (e.g., environmental monitoring, precision farming, sorting,
quality control, diagnostics, etc.).
To work with the large quantity of hyperspectral data
contained within a datacube, Resonon developed a proprietary
software called Spectronon. Since Spectronon’s creation in 2005, we have been continually
refining, improving, and enhancing its capabilities. Since that time, many
thousands of people have downloaded Spectronon.
Spectronon, along with sample datacubes, is available for free download. We provide these to everyone because we believe that access to hyperspectral imaging data and software is needed to understand and appreciate the capabilities of spectral imaging.
Features of Spectronon
Visualize Hyperspectral Data
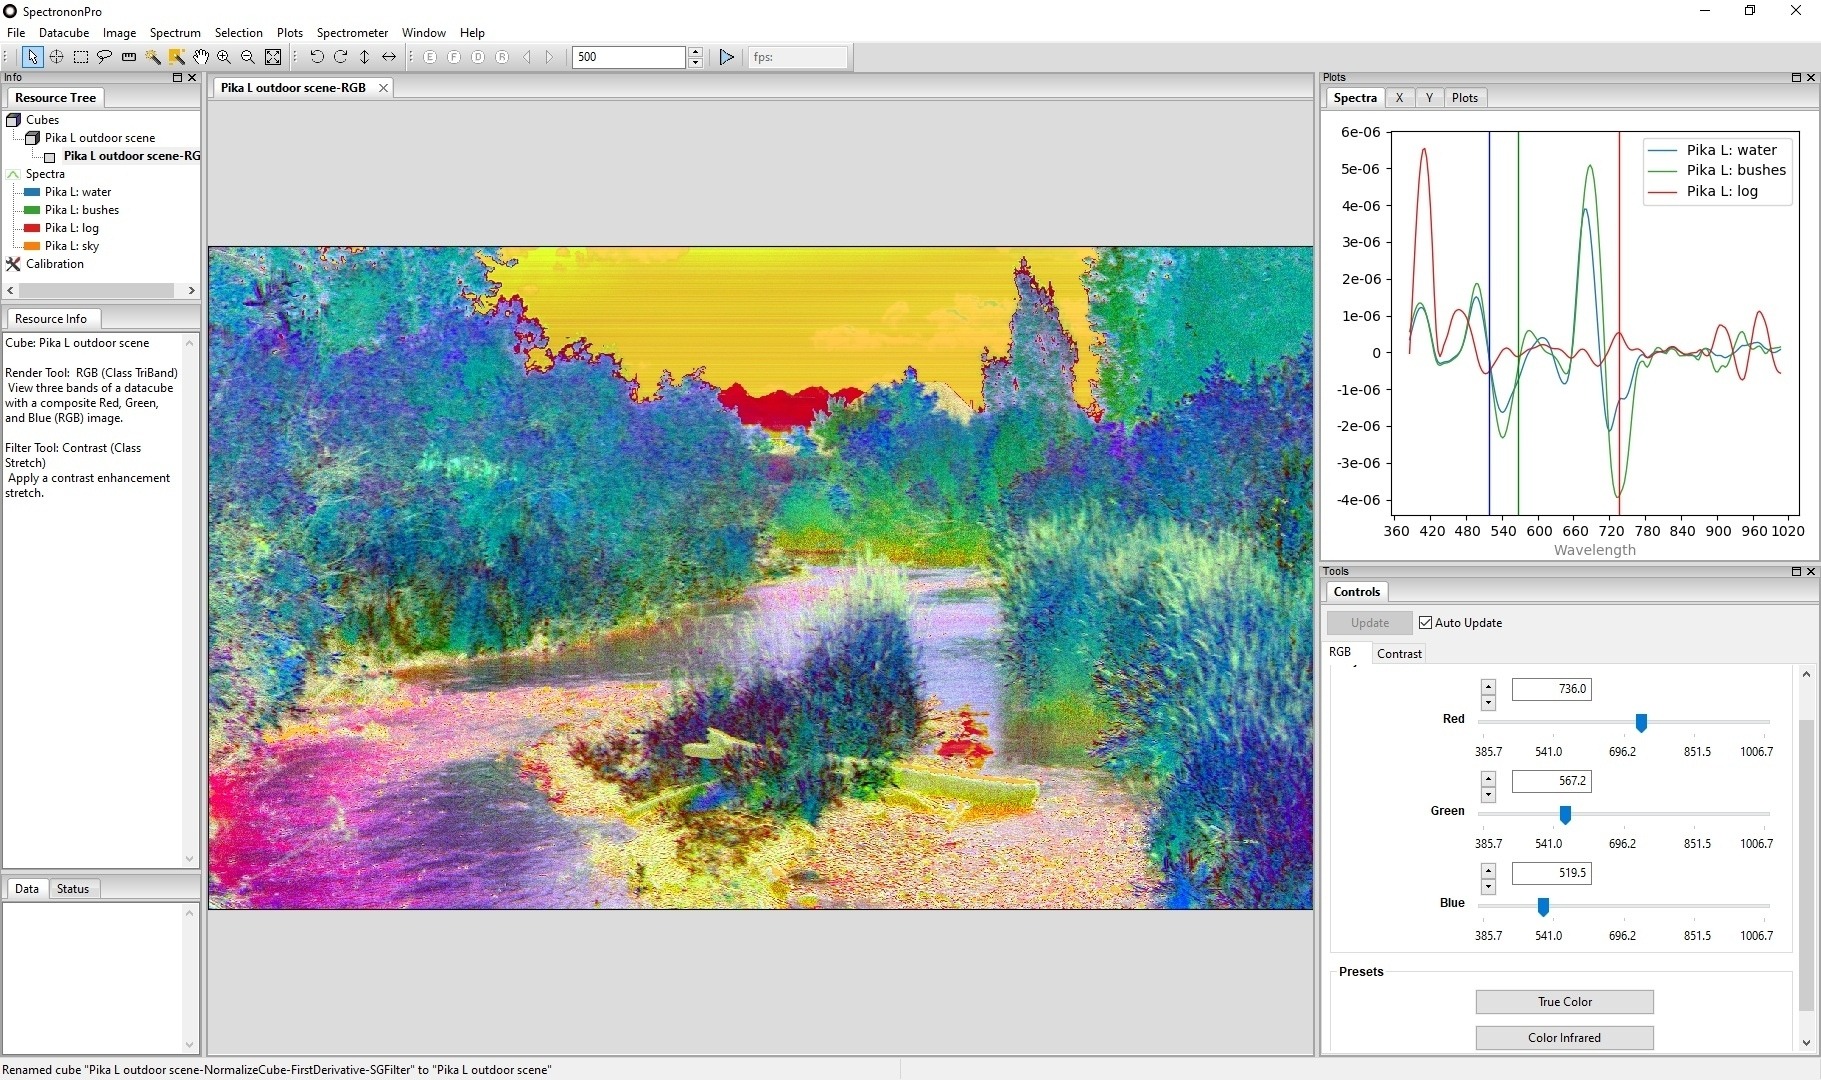
Spectronon’s visualization capabilities
allow you to see hyperspectral images in many ways to facilitate
interpretation of the spectral data. For
example, Spectronon makes it easy to see the spectrum of a single pixel or a
user-selected group of pixels.
Below, in
Figure 1, the small gray boxes inside the green and blue circles indicate selections
of pixels from two different types of candy that are nearly identical to the
human eye. The mean value and standard deviation of the spectra from these
pixels are plotted in green and blue in the upper right-hand corner of the Spectronon
display, as indicated by the green and blue arrows.
That plot (enlarged
in Figure 2) displays the wavelength vs. the signal of the pixels selected. One
can easily see the spectral difference between the two types of red candies.
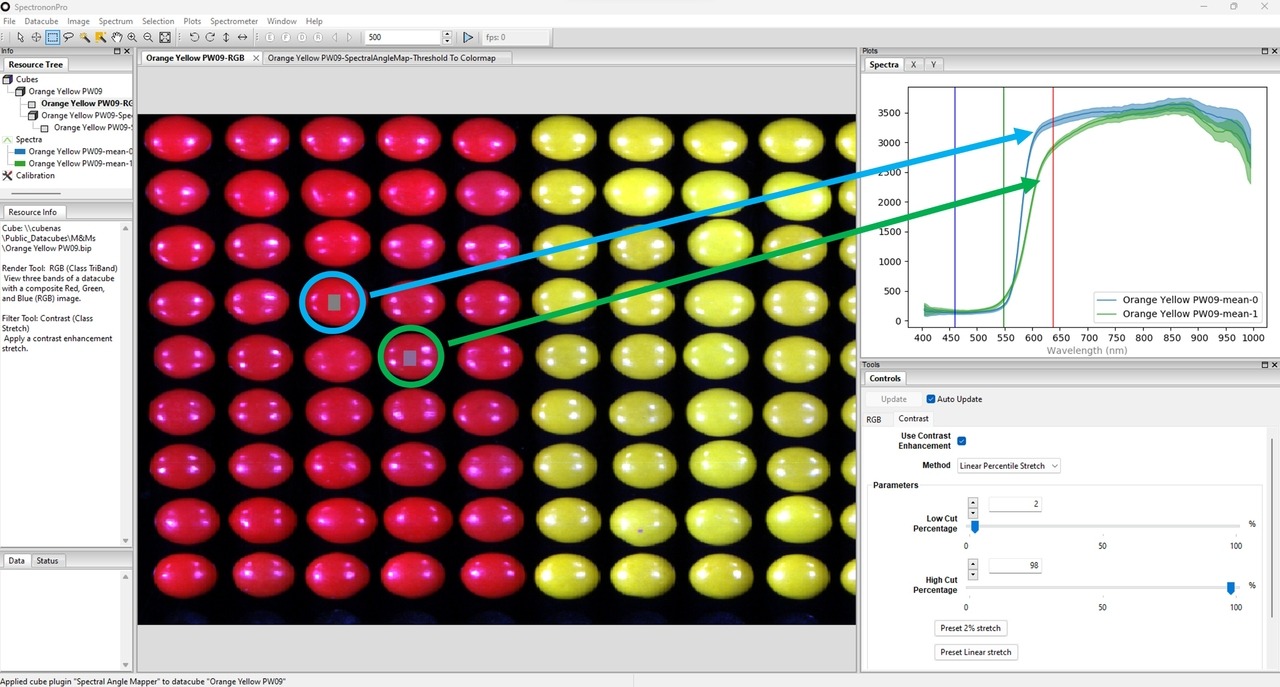
Figure 1: Screen capture from Spectronon showing spectral images of red and yellow candies. User friendly tools enable easy selection and examination of the spectrum for any pixel or the mean spectrum from a group of pixels.
That plot (enlarged
in Figure 2) displays the wavelength vs. the signal of the pixels selected. One
can easily see the spectral difference between the two types of red candies.
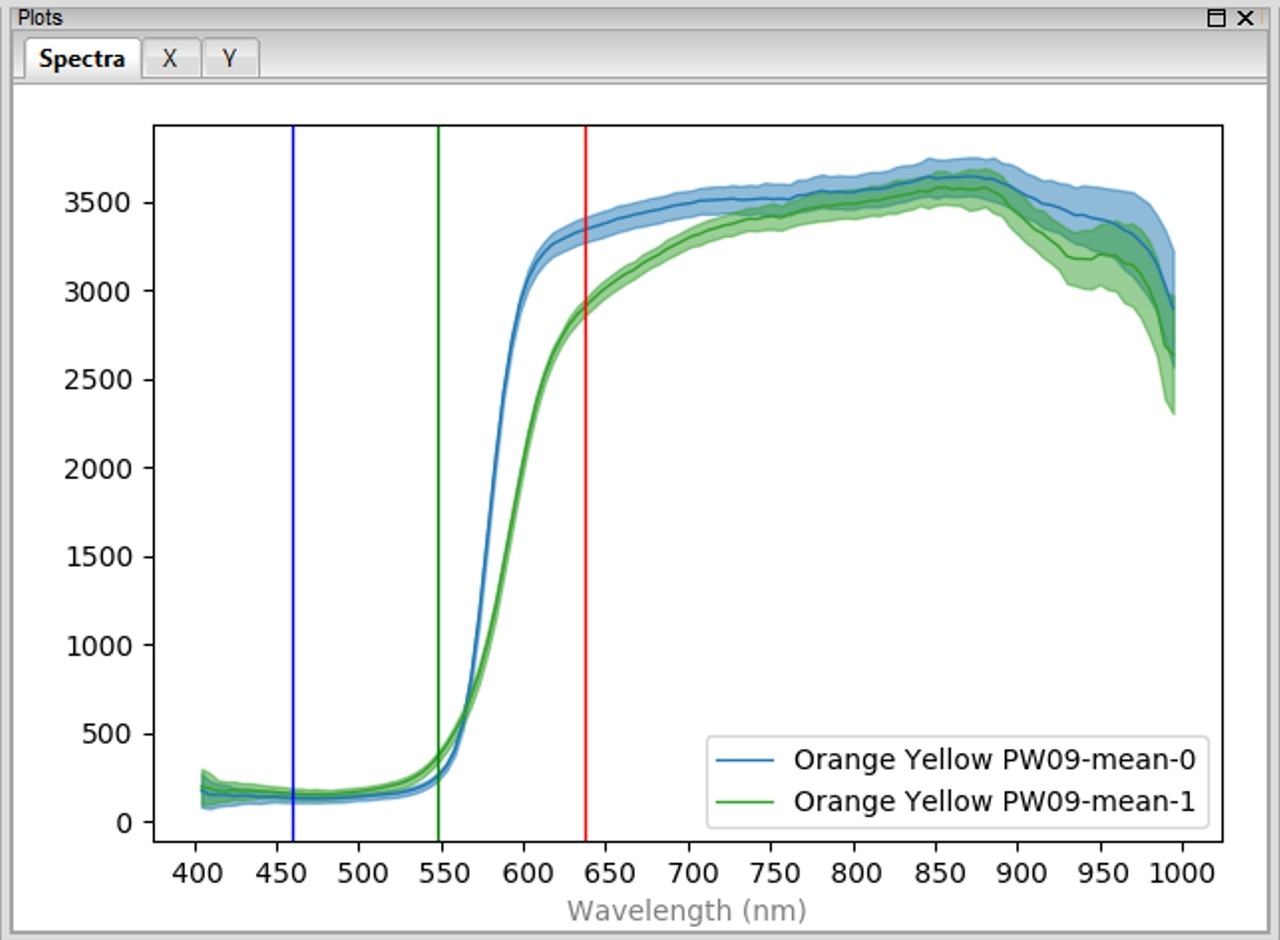
Figure 2: Spectra plot window in Spectronon showing the spectra and standard deviations from the two groups of pixels selected in Figure 1.
Analyze Hyperspectral Data
Spectronon comes with many standard
algorithms for classification and regression of hyperspectral data. Classification might be used to determine
a good product from a bad product. Regression is best suited to monitor
changes, such as how much an item has dried or how long it has been cooked.
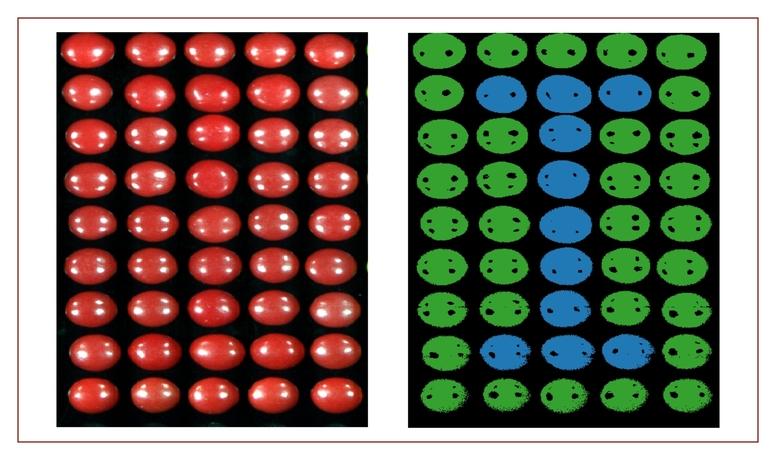
Figure 3, below, shows an example
classification map of hyperspectral imaging data using an algorithm known as the Spectral Angle Mapper (SAM). This algorithm compares
every pixel in the image to the blue and green spectra shown in the plot.
Pixels with spectra that are sufficiently similar to the blue spectrum are
colored blue, and those that are sufficiently similar to the green spectrum are
colored green. Pixels that are not similar to either spectrum are colored
black. The classification map clearly shows that there are two types of red
candy, with one type organized in the shape of an “I.” None of the yellow candy pixels have spectra similar to either type
of red candy, so pixels of the yellow candy are colored black. The thresholds
for similarity in the SAM algorithm are easily adjusted with the sliders
circled in red in Figure 3. Results from other built-in algorithms (Logistic
Regression, Random Forest, Euclidean distance, to name a few) can be quickly
compared to determine which algorithm provides the best results for your
particular application.
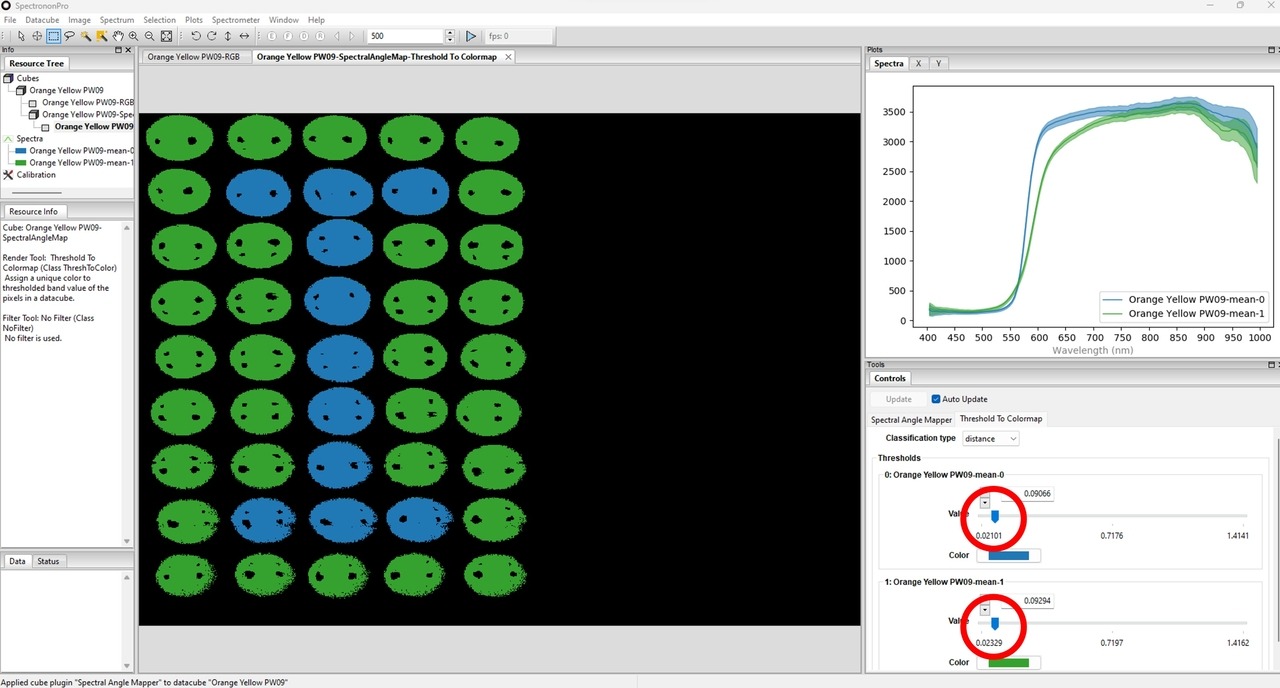
Figure 3: Classification map from Spectral Angle Mapper (SAM) analysis of the two red candy types.
Easy to Use and Customizable
Spectronon is designed for ease of use.
There is a quick start guide to get the user up and running. There is also a comprehensive user manual that includes clear descriptions of everything from basic to advanced capabilities
and the details behind all the algorithms. Introductory tutorial videos to get you up and running are available on our Library page.
Spectronon has the ability to perform batch
processing and data pre-processing steps. The user can also write their own plugins
(in Python), essential for those looking to combine their own analysis algorithms
with the power of Spectronon. Spectral plots can be saved as text files for
easy import into Excel, Python, or similar software for further analysis. Images can be
easily exported into many different file formats.
Getting Started with Spectronon
Download Spectronon and sample hyperspectral imaging datacubes to visualize, analyze, and gain a better understanding of the power of hyperspectral imaging.
For more details about Spectronon, see the User
Manual for Spectronon and the Tutorial Videos on our Library page.
If you want to collect your own
hyperspectral data, Resonon offers a variety of different hyperspectral imagers and hyperspectral systems to fit your particular application.
Contact us
Contact usLearn More
Basics Airborne
Getting Started with Airborne Hyperspectral Imaging SystemsOctober 27, 2023
Basics
An Introduction to Hyperspectral ImagingOctober 4, 2023
Contact Us
Click below and our hyperspectral experts will contact you soon.
Complete Hyperspectral Imaging Solutions
Contact
Resonon Inc.123 Commercial Drive
Bozeman, MT 59715 USA
