
Using Hyperspectral Imaging to Assess Salt Stress Tolerance in Crops
Resonon has reliable, well-calibrated sensors, along with great customer service. They are always approachable and helpful.
3,000 km^2
Farmland lost annually to salinity200,000+ km^2
Additional farmland each year with lowered production via salinity
Farmland lost annually to salinity200,000+ km^2
Additional farmland each year with lowered production via salinity
Challenge
Salinity stress occurs when excessive salt builds up
in soil and interferes with water absorption and nutrient uptake in crops. Over
time, salinity stress leads to decreased crop productivity.
Some regions of the world are facing rapid increases
in soil salinity, which is rendering large swaths of farmland unusable. With
less farmland, yield potential decreases and food insecurity increases.
Selecting salt-tolerant crop varieties is one
promising approach to addressing this problem; however, there needs to be a
more sensitive and less laborious method to assess and screen for salt
tolerance.
Solution
Hyperspectral imaging (HSI) is well suited to
investigate the internal structures, composition, and functions of plants. To
date, HSI has garnered attention for plant phenotyping because it allows
investigators to observe how plants are impacted by environmental variables.
Researchers at the University of
Minnesota set out to assess and
quantitatively rank salt tolerance in wheat using HSI and image analysis.
The investigators sought to rank four different wheat lines based on their stress tolerance, establish a method for quantitative ranking (rather than qualitative), and evaluate the feasibility of precision ranking.
Application Overview
To develop a method for
analyzing hyperspectral images, four bread wheat lines, with varying levels of
salt tolerance, were assayed in a hydroponic system with control and salt
treatments. A push broom hyperspectral camera and glider gear were used for image
acquisition 24 hours after salt application. Once collected, images were
calibrated to account for non-uniformities. From there, investigators proceeded
to run three methods to analyze hyperspectral images of wheat lines: area under
the normalized reflectance distance (NRD) curve, minimum difference of pair
assignments (MDPA), and posterior probability.
Equipment Used
The experimental setup
included a push broom (i.e., along-track scanner) hyperspectral camera,
Resonon’s Pika II (now the Pika L), for image
acquisition. The camera scanned over 240 spectral channels ranging from 400 to
900 nm with a spectral resolution of about 2.1 nm. In the along-track
direction, the number of pixels was set to 2,000 so both the control group and
the salt treatment group were captured in a single image. During image
processing, radiometric calibration was performed using Resonon’s Spectronon software.

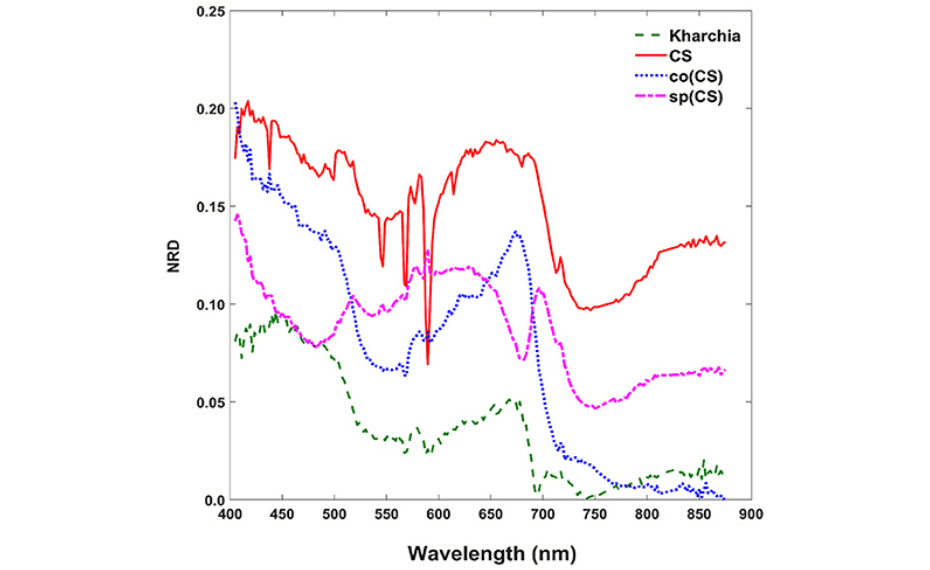
In the figure above, NRD (Normalized Reflectance Difference) for four different wheat lines is plotted. The NRD represents the change in reflectance
over each wavelength sampled
of the salt-stressed wheat compared to the control group for the four different lines tested. A lower NRD value signifies a wheat line that is more tolerant to salt stress.
Results
- This method demonstrates a more feasible means of ranking salt tolerance in individual wheat lines (from a labor and cost perspective).
- The investigators were able to illustrate quantitative, non-invasive means of phenotyping plants using machine learning and Hyperspectral Imaging.
Download the article, download the hyperspectral datacubes used in the study, or see all precision agricultural application examples.
Contact us
Contact usMore Case Studies
Contact Us
Click below and our hyperspectral experts will contact you soon.
Complete Hyperspectral Imaging Solutions
Contact
Resonon Inc.123 Commercial Drive
Bozeman, MT 59715 USA
